





Entertainment

Share
Published 12:04 21 Oct 2026 BST
Updated 12:10 21 Oct 2026 BST
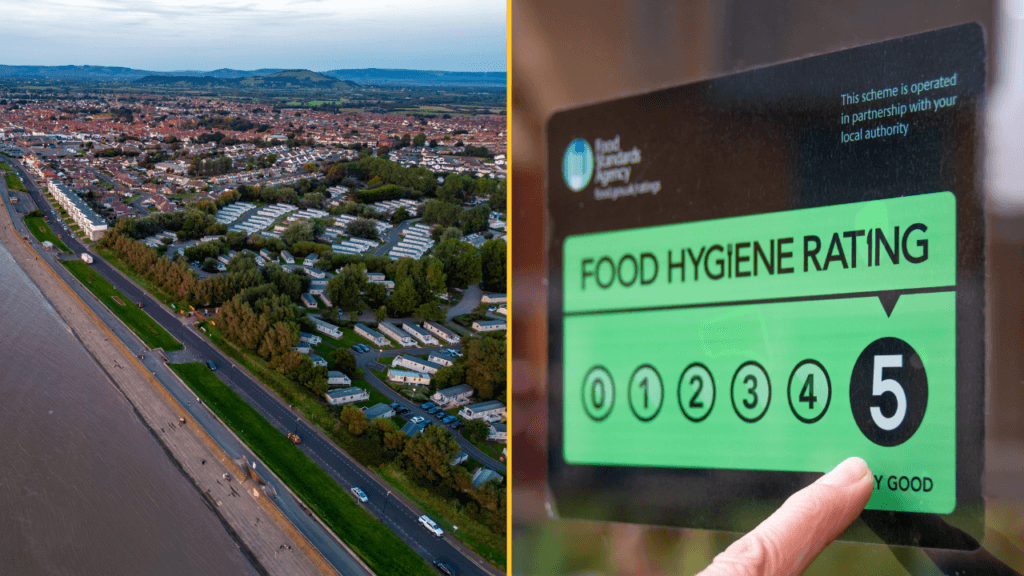
That fabled green sticker, those six circles in the middle counting from 0 up to 5, the five star rating that beckons you and says 'come in and eat, I won't give you food poisoning'.
That is the beauty of the Food Standards Agency's Food Hygiene Rating which people in the UK will find across the nation in shop windows and behind counters.
While in England and Scotland, it is not a legal requirement to display the score, every commercial food seller, in a shop or in a home kitchen, must be registered and scored by the local authority.
Wales and Northern Ireland take this one step further and require all food businesses to display their rating.
The thing that's so great about every food vendor in the UK requiring a score which is made publicly available, organisations like HygieneWatch can aggregate this data to create a monthly-updated league table of towns with the best and worst average hygiene ratings.
It must also be noted that while the lowest ranked of the bottom 10 comes in at 3.89, this does not mean the food is unsafe to eat. A rating of a flat three means it is "safe to eat from, but requires improvement in specific areas."
In general the vast majority of food vendors in the UK abide by the Food Standards Agency's rules and hygiene across the nation is high quality.
So, without further ado, here are the top 10 and bottom 10 ranked towns for October 2026.
Stipulation: For a town to qualify in this list it must have at least 100 registered and rated food establishments.
You can find the entire list here at HygieneWatch.
Explore more on these topics:

Entertainment
Entertainment
Entertainment

Entertainment
UK inflation rate hits 3.5% as fuel prices surge
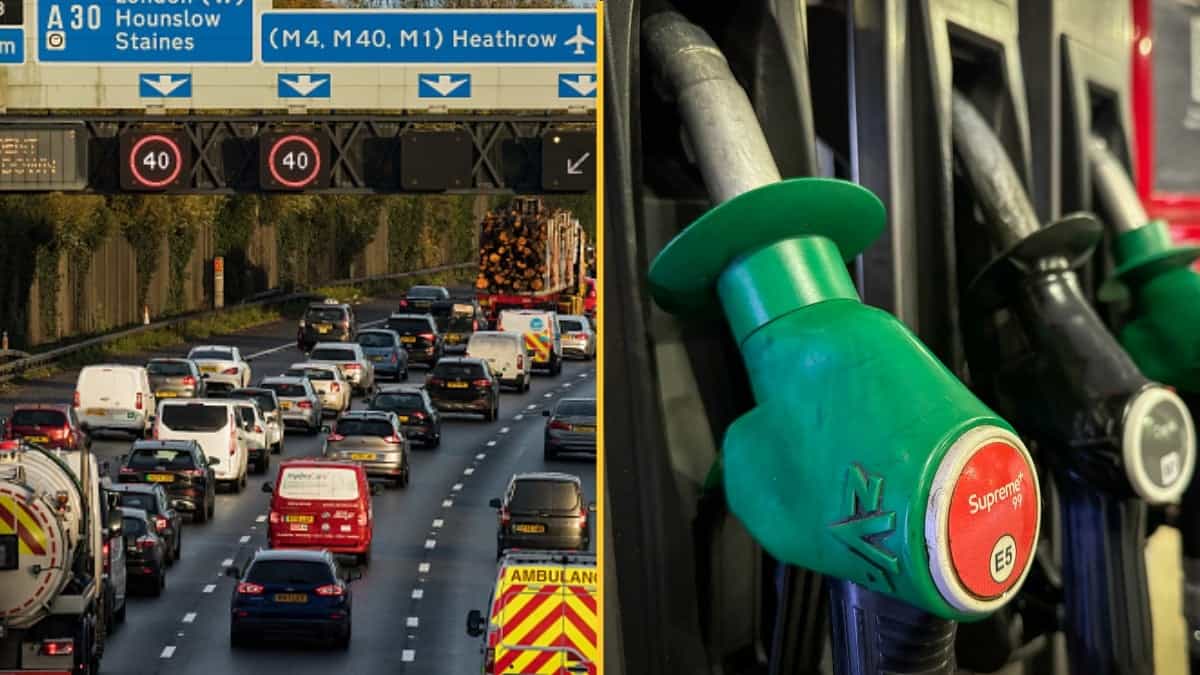
The steepest climb in close to a year As fuel costs piled pressure on households ahead of the Budget, the UK inflation rate jumped to 3.5% in September. The headline rate climbed to 3.5% last month, up from 3.1% in August, the Office for National Statistics confirmed on Wednesday. That marks the sharpest annual rise […]
Entertainment
2h
When do the clocks go back this year as British summer time comes to an end
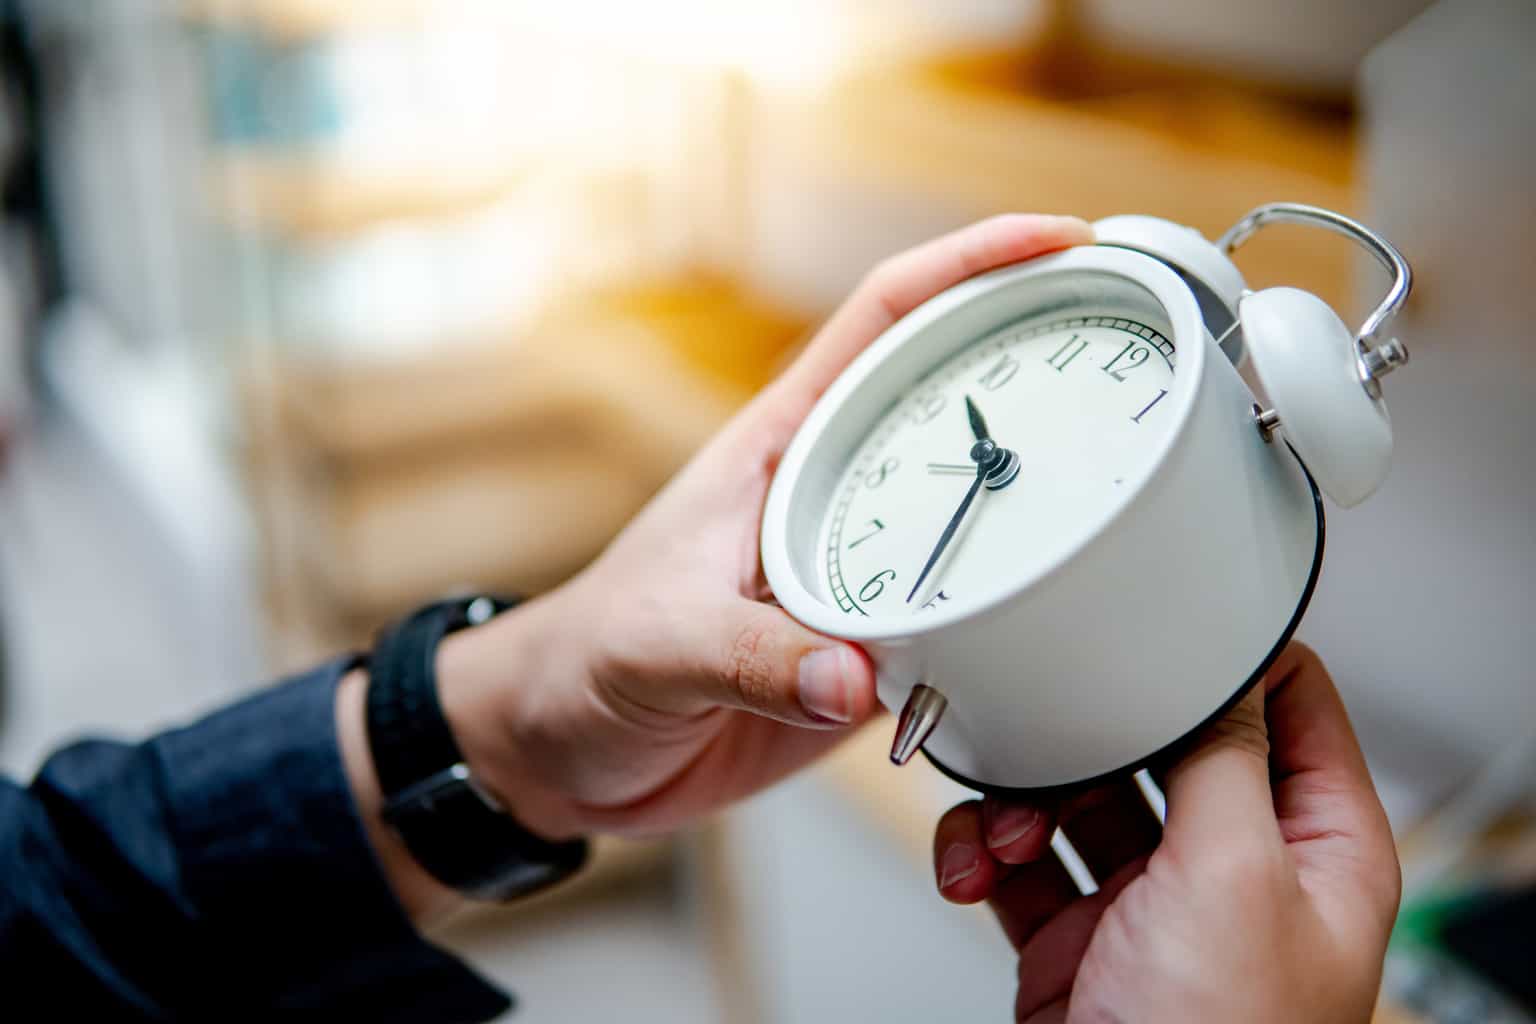
Daylight saving time ends this weekend People across the UK will get an extra hour in bed this Sunday as the clocks go back, marking the end of British Summer Time (BST). The change takes place at 2am on 25 October, when clocks move back to 1am and the country returns to Greenwich Mean Time […]
Entertainment
18h
Entertainment
Kim Jong-un pictured alive after extraordinary claims North Korean leader had died
Entertainment